Weekly Report of China Export Container Transport Market(CCFI Commentary in Issue 33, 2011)
This week, the China’s containerized transport market maintained firm, with the composite index slightly increased. On August 12th, the China Containerized Freight Index issued by Shanghai Shipping Exchange was 983.52 points, up 0.5% from last week; while the Shanghai Containerized Freight Index came out at 1033.24 points, up 1.4% from last week.
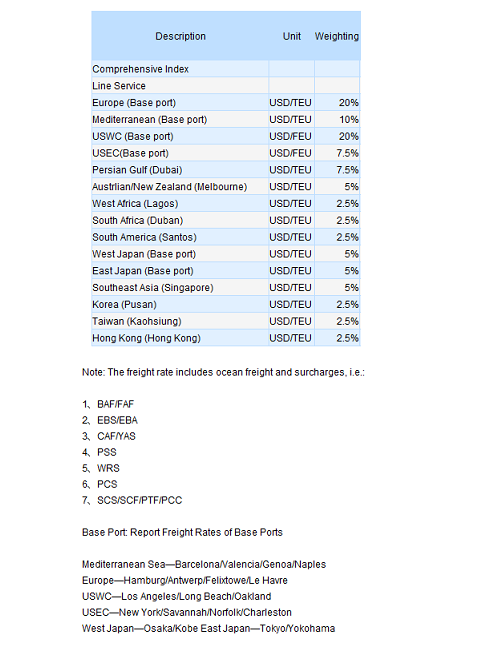
In Europe service this week, the cargo volume hiked steadily, buoying the slot utilization up to above 90% with some voyages running out of slots. The thriving market quotation stabilized the freight rate after its previous upturn, while in some voyages the price continued went up with the upward trajectory of last week. On August 12th, the freight rate (ocean freight plus surcharges) of the voyages from Shanghai to base ports in Europe service reported USD 828/TEU, up 0.6% from last week. In Mediterranean service, the ongoing conventional peak season stimulated the slot utilization to above 95%, with the freight rates over the west Mediterranean voyages climbed up to USD 1050/TEU. On August 12th, the freight rate (including ocean freight and surcharges) of the voyages to Mediterranean service was USD 1019/TEU, up 5.5% from last week.
In North America, a sharp differential turned up between the west- and east-bound services. In US west coast service the cargo remained sluggish and the slot utilization stood at about 85%. Freight rate kept dipping, while for some voyages the price had even fallen to USD 1300/FEU, which is near half of what it was a year earlier. On August 12th, the freight index of the US west coast service reported 903.59 points, down 1.7% from last week. The US east coast service was seen bullish, giving the limited capacity influx, sound supply-demand relation, and a 95% slot utilization, which in some cases it was 100%. On August 12th, the freight index of the US east coast service was 1191.18 points, basically equaling to last week. Thanks to the coming conventional peak season, carriers were poised to announce a USD 400/FEU peak season surcharge since August 15th. However, people were afraid of the plan’s implementation as the weak cargo volume and the excessive capacity could not be ignored. As a result, some were reported delaying the announcement to 22nd and cutting the price added.
However, whether the implementation will be fulfilled was conceived as an uncertainty by the market citing the weak cargo volume and the excessive capacity.
In Australia and Singapore service, the approaching conventional peak season left the cargo volume in a strong upward momentum, where the slot utilization hovering above 95% and more voyages were reported laden. Freight rate kept ascending because of the improved supply-demand relations. On August 12th, the freight rate (ocean freight plus surcharges) of the Australia and Singapore service appeared USD 833/TEU, burst by 16.7% from last week. Considering the outstanding performance of the cargo volume, carriers tended to uplift the freight rate once again by about USD 200/TEUl.
In Persian Gulf service, inflicting by the Ramadan, the cargo volume kept slipping and the slot utilization revealed at 90%. Freight rate kept the slumping behavior of last week. On August 12th, the freight rate (ocean freight plus surcharges) of the voyages from Shanghai to base ports in Persian Gulf service quoted USD 953/TEU, down 0.7% from last week. As the demand of the capacity generally restrained, some carriers would cut their capacity by switching small tonnages into larger ones.


lunes, 22 de agosto de 2011

jueves, 28 de julio de 2011
CCFI Commentary Issue 29, 2011
Weekly Report of China Export Container Transport Market
This week, the China’s containerized transport market plunged slightly, while the comprehensive index decreased as well.
On July 15th, the China Containerized Freight Index issued by Shanghai Shipping Exchange was 983.84 points, down 0.5% from last week; while the Shanghai Containerized Freight Index came out at 1016.87 points, down 1.3% from last week.
In Europe service, the market carried on the trend of last week as the slot utilization stayed above 90%. But because of the ongoing capacity glut and the sliding freight rate, the service was regard less prosperous than it was a year earlier. On July 15th, the freight rate (ocean freight plus surcharges) of the voyages from Shanghai to base ports in Europe quoted USD 809/TEU, down 1% from last week. Some carriers were said to announce a peak season surcharge in August, but the plan seemed hard to implement because of the surplus fleet. While in Mediterranean the cargo volume tumbled marginally, causing a week-on-week descent over the slot utilization, which is about 90% currently. On July 15th, the freight rate (ocean freight plus surcharges) of the voyages to the base ports in Mediterranean showed USD 926/TEU, down 1.6% from last week.
In North America service this week the cargo volume kept at a high level as there’s a 95% slot utilization in US east coast, where some vessels running out of slots; while the US west coast service behaved not bad as well. Since the amount of fleet didn’t swung much, freight rate barely changed. On July 15th, the freight indices of the US west coast and US east coast services were 947.93 points and 1194.57 points, both grossly equaling to last week. The jobless rate of US had been reported soaring for 3 consecutive months to 9.2%, which would conceivably weaken not only its resident’s purchasing power but also the willingness, with a further impact over the procurement demand during this peak season. Besides, people could also conclude a pessimistic attitude from the carriers given the postponement of the PPS originally planned to impose on July 15th to after August 1st.
In Japan service there wasn’t much change over the cargo volume, where the slot utilization hovered at 70%. Freight rate maintained steadily. On July 15th, the freight index of the Japan service issued by SSE reported 789.06 points, basically the same as last week.
The approaching Ramadan was continuously pushing down the cargo volume exporting to the Persian Gulf with the slot utilization standing at 90%, and freight rate will apparently keep sluggish. It was said that carriers would like to have some surcharge to offset the bearish freight rate, but there’s no indication of when. On July 15th, the freight rate (ocean freight plus surcharges) for the voyages heading to Persian Gulf quoted USD 1005/TEU, down 1.1% from last week.
In Australia and Singapore service the cargo volume was seen firm and the slot utilization reveal at 90%. Freight rate was slightly pushed up by some carriers. Since the market was switching from the slack season to a peak period, cargo volume was estimated to hold still in July and it won’t start rallying until late August. On July 15th, the freight index of the Australia and Singapore service reported 926.73 points, up 1.1% from last week. Owing to the over-deployed capacity, the service proved less profitable than last year.
This week, the China’s containerized transport market plunged slightly, while the comprehensive index decreased as well.
On July 15th, the China Containerized Freight Index issued by Shanghai Shipping Exchange was 983.84 points, down 0.5% from last week; while the Shanghai Containerized Freight Index came out at 1016.87 points, down 1.3% from last week.
In Europe service, the market carried on the trend of last week as the slot utilization stayed above 90%. But because of the ongoing capacity glut and the sliding freight rate, the service was regard less prosperous than it was a year earlier. On July 15th, the freight rate (ocean freight plus surcharges) of the voyages from Shanghai to base ports in Europe quoted USD 809/TEU, down 1% from last week. Some carriers were said to announce a peak season surcharge in August, but the plan seemed hard to implement because of the surplus fleet. While in Mediterranean the cargo volume tumbled marginally, causing a week-on-week descent over the slot utilization, which is about 90% currently. On July 15th, the freight rate (ocean freight plus surcharges) of the voyages to the base ports in Mediterranean showed USD 926/TEU, down 1.6% from last week.
In North America service this week the cargo volume kept at a high level as there’s a 95% slot utilization in US east coast, where some vessels running out of slots; while the US west coast service behaved not bad as well. Since the amount of fleet didn’t swung much, freight rate barely changed. On July 15th, the freight indices of the US west coast and US east coast services were 947.93 points and 1194.57 points, both grossly equaling to last week. The jobless rate of US had been reported soaring for 3 consecutive months to 9.2%, which would conceivably weaken not only its resident’s purchasing power but also the willingness, with a further impact over the procurement demand during this peak season. Besides, people could also conclude a pessimistic attitude from the carriers given the postponement of the PPS originally planned to impose on July 15th to after August 1st.
In Japan service there wasn’t much change over the cargo volume, where the slot utilization hovered at 70%. Freight rate maintained steadily. On July 15th, the freight index of the Japan service issued by SSE reported 789.06 points, basically the same as last week.
The approaching Ramadan was continuously pushing down the cargo volume exporting to the Persian Gulf with the slot utilization standing at 90%, and freight rate will apparently keep sluggish. It was said that carriers would like to have some surcharge to offset the bearish freight rate, but there’s no indication of when. On July 15th, the freight rate (ocean freight plus surcharges) for the voyages heading to Persian Gulf quoted USD 1005/TEU, down 1.1% from last week.
In Australia and Singapore service the cargo volume was seen firm and the slot utilization reveal at 90%. Freight rate was slightly pushed up by some carriers. Since the market was switching from the slack season to a peak period, cargo volume was estimated to hold still in July and it won’t start rallying until late August. On July 15th, the freight index of the Australia and Singapore service reported 926.73 points, up 1.1% from last week. Owing to the over-deployed capacity, the service proved less profitable than last year.
miércoles, 27 de julio de 2011
Falling freight rates, increasing lay-ups depress charter market prices
THE charter market for containerships is slipping fast in the face of sliding freight rates and increasing lay-ups, according to Alphaliner analysts, which adds that current trends indicate charter rates will fall even more by the end of the year.
Maersk, MSC, CMA CGM continue to be active charterers, but CSAV is re-chartering surplus ships. Alphaliner says CSAV's continuous cutting of services will result in the Chilean carrier removing 100,000 TEU from its slot capacity by the end of August.
Further capacity could be lost if rates continue to fall. The top-four charterers - Maersk, MSC, CMA CGM and CSAV - account for more than 25 per cent of all fixtures. Any slowdown by any of them will have a significant impact on the market, it said.
Because of uncertain market conditions, more charterers are unwilling to sign longer-term deals. This trend is aggravated by the fact that owners have had to accept short charters in an increasingly fragile market as demand weakens.
Both the number of fixtures and the fixture periods have declined significantly since April. Charter rates have dropped by 11 per cent on average in the last three months, with all size segments affected.
Rates are likely to drop in coming months as demand slackens. InJune, the number of reported fixtures reached at the lowest level this year. The average duration of fixtures was cut from 10 months at the beginning of this year to seven months currently.
Maersk, MSC, CMA CGM continue to be active charterers, but CSAV is re-chartering surplus ships. Alphaliner says CSAV's continuous cutting of services will result in the Chilean carrier removing 100,000 TEU from its slot capacity by the end of August.
Further capacity could be lost if rates continue to fall. The top-four charterers - Maersk, MSC, CMA CGM and CSAV - account for more than 25 per cent of all fixtures. Any slowdown by any of them will have a significant impact on the market, it said.
Because of uncertain market conditions, more charterers are unwilling to sign longer-term deals. This trend is aggravated by the fact that owners have had to accept short charters in an increasingly fragile market as demand weakens.
Both the number of fixtures and the fixture periods have declined significantly since April. Charter rates have dropped by 11 per cent on average in the last three months, with all size segments affected.
Rates are likely to drop in coming months as demand slackens. InJune, the number of reported fixtures reached at the lowest level this year. The average duration of fixtures was cut from 10 months at the beginning of this year to seven months currently.
miércoles, 6 de julio de 2011
Capacity growth to reach 8.8% in 2011
Cellular containership capacity is expected to grow by an average annual rate
of 8.7% over the next two years, with 1.26 Mteu due to be added in 2011 and
1.33 Mteu in 2012, based on Alphaliner projections. These figures follow the
1.20 Mteu which have been added to the fleet in 2010. Although the fleet increases
over 2011-2012 will not reach the figures recorded in 2006-2008,
when an average of 1.37 Mteu per year were added, the level of capacity additions
remains a key concern for the industry.
![]()
A large part of the new capacity added in 2010 was absorbed by the increased
demand that was caused by the rapid economic recovery. Throughput volumes
at the world’s five busiest container ports grew by 18% on average in the first
three quarters of 2010. However, the average growth at these ports has slowed
to 8% in the fourth quarter, with the trend towards slower growth likely to persist
into 2011.
The slowing of the demand in the fourth quarter has already started to hurt carriers’
load factors. Alphaliner estimates of vessel utilization levels on the Far
East-US and Far East-Europe routes dropped to only 80% in December, the lowest
levels recorded since May 2009. Attention must now be shifted to utilization
levels in the next two months, as these will determine the direction of
freight rates after the Lunar New Year celebrations in the Far East.
Aphaliner
of 8.7% over the next two years, with 1.26 Mteu due to be added in 2011 and
1.33 Mteu in 2012, based on Alphaliner projections. These figures follow the
1.20 Mteu which have been added to the fleet in 2010. Although the fleet increases
over 2011-2012 will not reach the figures recorded in 2006-2008,
when an average of 1.37 Mteu per year were added, the level of capacity additions
remains a key concern for the industry.

A large part of the new capacity added in 2010 was absorbed by the increased
demand that was caused by the rapid economic recovery. Throughput volumes
at the world’s five busiest container ports grew by 18% on average in the first
three quarters of 2010. However, the average growth at these ports has slowed
to 8% in the fourth quarter, with the trend towards slower growth likely to persist
into 2011.
The slowing of the demand in the fourth quarter has already started to hurt carriers’
load factors. Alphaliner estimates of vessel utilization levels on the Far
East-US and Far East-Europe routes dropped to only 80% in December, the lowest
levels recorded since May 2009. Attention must now be shifted to utilization
levels in the next two months, as these will determine the direction of
freight rates after the Lunar New Year celebrations in the Far East.
Aphaliner
CCFI Commentary Issue 26, 2011
Weekly Report of China Export Container Transport Market
(CCFI Commentary in Issue 26, 2011)
This week, the China’s containerized transport market was little better, as the comprehensive index was still seen sluggish. On June 24th, the China Containerized Freight Index issued by Shanghai Shipping Exchange reported 981.65 points, down 1.7% from last week; while the Shanghai Containerized Freight Index came out at 1024.77 points, down 0.6% from last week.
In Europe service, the demand for the capacity maintained an upward momentum, with a 90% slot utilization. Insiders estimated that there would be a drastic boost of the cargo volume on the first week of July, following a slots scarcity in the next one as the arrival of the conventional peak season. Affected by such optimism, the prevailing freight rate somehow tempered its falling trend while some carriers slightly uplift the freight rate. On June 24th, the freight rate (ocean freight plus surcharges) of the voyages from Shanghai to base ports in Europe and Mediterranean services were USD 845/TEU and USD 953/TEU, respectively down 0.5% and 0.2% from last week. The current freight rate on the service was reported staying below the breakeven point, so some carriers would shut off some routes if the freight rate kept dipping.
The North America service seemed bearish this week, and the cargo volume was still depressing as last week. Slot utilizations in US west and US east reported only 80% and 90% respectively. Since the service became less profitable, some carriers had already announced to suspend their voyages. The continuously descending freight rate had mostly nullified the conventional peak season, leaving some carriers delaying the PSS plan till mid-June. On June 24th, the freight indices of the US west and US east coast services issued by SSE were 938.48 points and 1174.13 points, respectively tumbled by 2.3% and 0.6% from last week. Pundits indicated that several carriers like Hanjin and APL would adopted a new formula to account the BAF in 3rd quarter, which will probably cut the existing one, published by the TSA on the US west and US east coast services, by USD 30/TEU and USD 48/TEU. Besides, carriers are expecting a shipment rally when mid-June and consequently kicks up the freight rate.
In Japan service this week the slot utilization climbed up to 70%. Moreover, the port congestions occurred a few weeks ago had been just relieved, resuming the shipping schedule of most voyages. On June 24th, the freight index of the Japan service issued by SSE reported 789.25 points. After the abolition of the emergency cost surcharge of Shanghai on June 1st, ports of northern China were said to go with the flow on August 1st. Relevant news might be released in the next few weeks.
In Persian Gulf service this week the cargo volume saw flat with a slot utilization of 85%. The Ramadan over the middle-east region started on August 1st and will possibly pressure the cargo volume in mid-July. Meanwhile, inflicted by the poor Europe service, the freight rate was perceived steadily decreasing. On June 24th, the freight rate (ocean freight plus surcharges) of the voyages from Shanghai to Persian Gulf quoted USD 1014/TEU, down 0.5% from last week.
In Australia and Singapore service the cargo volume hardly changed, with the slot utilization hovering from 80% to 85%. Pundits believed that the freight rate won’t stop dropping until mid-July. On June 24th, the freight index of the Australia and Singapore service reported 934.51 points, down 1.1% from last week.
(CCFI Commentary in Issue 26, 2011)
This week, the China’s containerized transport market was little better, as the comprehensive index was still seen sluggish. On June 24th, the China Containerized Freight Index issued by Shanghai Shipping Exchange reported 981.65 points, down 1.7% from last week; while the Shanghai Containerized Freight Index came out at 1024.77 points, down 0.6% from last week.
In Europe service, the demand for the capacity maintained an upward momentum, with a 90% slot utilization. Insiders estimated that there would be a drastic boost of the cargo volume on the first week of July, following a slots scarcity in the next one as the arrival of the conventional peak season. Affected by such optimism, the prevailing freight rate somehow tempered its falling trend while some carriers slightly uplift the freight rate. On June 24th, the freight rate (ocean freight plus surcharges) of the voyages from Shanghai to base ports in Europe and Mediterranean services were USD 845/TEU and USD 953/TEU, respectively down 0.5% and 0.2% from last week. The current freight rate on the service was reported staying below the breakeven point, so some carriers would shut off some routes if the freight rate kept dipping.
The North America service seemed bearish this week, and the cargo volume was still depressing as last week. Slot utilizations in US west and US east reported only 80% and 90% respectively. Since the service became less profitable, some carriers had already announced to suspend their voyages. The continuously descending freight rate had mostly nullified the conventional peak season, leaving some carriers delaying the PSS plan till mid-June. On June 24th, the freight indices of the US west and US east coast services issued by SSE were 938.48 points and 1174.13 points, respectively tumbled by 2.3% and 0.6% from last week. Pundits indicated that several carriers like Hanjin and APL would adopted a new formula to account the BAF in 3rd quarter, which will probably cut the existing one, published by the TSA on the US west and US east coast services, by USD 30/TEU and USD 48/TEU. Besides, carriers are expecting a shipment rally when mid-June and consequently kicks up the freight rate.
In Japan service this week the slot utilization climbed up to 70%. Moreover, the port congestions occurred a few weeks ago had been just relieved, resuming the shipping schedule of most voyages. On June 24th, the freight index of the Japan service issued by SSE reported 789.25 points. After the abolition of the emergency cost surcharge of Shanghai on June 1st, ports of northern China were said to go with the flow on August 1st. Relevant news might be released in the next few weeks.
In Persian Gulf service this week the cargo volume saw flat with a slot utilization of 85%. The Ramadan over the middle-east region started on August 1st and will possibly pressure the cargo volume in mid-July. Meanwhile, inflicted by the poor Europe service, the freight rate was perceived steadily decreasing. On June 24th, the freight rate (ocean freight plus surcharges) of the voyages from Shanghai to Persian Gulf quoted USD 1014/TEU, down 0.5% from last week.
In Australia and Singapore service the cargo volume hardly changed, with the slot utilization hovering from 80% to 85%. Pundits believed that the freight rate won’t stop dropping until mid-July. On June 24th, the freight index of the Australia and Singapore service reported 934.51 points, down 1.1% from last week.
lunes, 30 de mayo de 2011
Oversupply fears already emerging for 2013
CONTAINERSHIP deliveries are expected to reach a record high of two million TEU in 2013, according to a recent report by maritime analyst, Alphaliner, which if accurate could signal a significant oversupply problem on the horizon.
According to Alphaliner's figures, new vessel orders for delivery in 2013 have increased from 0.38 million TEU to 1.59 million TEU in the last 12 months, exceeding the 1.57 million TEU in 2008.

New orders have also outpaced deliveries in the past 12 months.
Alphaliner's data shows that a total of 222 containerships, not including undeclared options, have been ordered, while containership deliveries reached 214 units…
"With all 2011 and most of 2012 delivery slots currently booked, attention now turns to 2013 slots. Scheduled deliveries for 2013 have surged from 380,000 TEU a year ago to 1.59 million TEU today, and there is still available shipyard capacity for 2013 deliveries. If all current options, letters of intent (LOI) and intended orders were exercised, 2013 vessel deliveries could exceed two million TEU," Alphaliner said.
The new orders bring the capacity growth forecast for 2013 to 8.9 per cent, which is expected to increase further to 11.3 per cent if options and LOIs are added.
Besides, shipowners have placed orders for a total of 1.6 million TEU of new capacity since June 2010, surpassing deliveries recorded in the same period that hit 1.4 million TEU.
Since January 2010, a total of 1.58 million TEU of new containerships have been ordered. Of those newly ordered vessels, carriers' orders account for 67 per cent or 1.06 million TEU, while orders from non-operating owners (NOO) account for the rest of the 30 per cent or 0.52 million TEU, Alphaliner said.
Overall, Alphaliner's figures reveal that the total investments in new containerships since January 2010 have swollen to US$18.8 billion.
According to Alphaliner's figures, new vessel orders for delivery in 2013 have increased from 0.38 million TEU to 1.59 million TEU in the last 12 months, exceeding the 1.57 million TEU in 2008.

New orders have also outpaced deliveries in the past 12 months.
Alphaliner's data shows that a total of 222 containerships, not including undeclared options, have been ordered, while containership deliveries reached 214 units…
"With all 2011 and most of 2012 delivery slots currently booked, attention now turns to 2013 slots. Scheduled deliveries for 2013 have surged from 380,000 TEU a year ago to 1.59 million TEU today, and there is still available shipyard capacity for 2013 deliveries. If all current options, letters of intent (LOI) and intended orders were exercised, 2013 vessel deliveries could exceed two million TEU," Alphaliner said.
The new orders bring the capacity growth forecast for 2013 to 8.9 per cent, which is expected to increase further to 11.3 per cent if options and LOIs are added.
Besides, shipowners have placed orders for a total of 1.6 million TEU of new capacity since June 2010, surpassing deliveries recorded in the same period that hit 1.4 million TEU.
Since January 2010, a total of 1.58 million TEU of new containerships have been ordered. Of those newly ordered vessels, carriers' orders account for 67 per cent or 1.06 million TEU, while orders from non-operating owners (NOO) account for the rest of the 30 per cent or 0.52 million TEU, Alphaliner said.
Overall, Alphaliner's figures reveal that the total investments in new containerships since January 2010 have swollen to US$18.8 billion.
CCFI Commentary Issue 21, 2011
Weekly Report of China Export Container Transport Market
(CCFI Commentary in Issue 21, 2011)
This week, the China containerized transport market remained sound, with a stable comprehensive index. On May 20th, the China Containerized Freight Index issued by Shanghai Shipping Exchange was 1013.37 points; while the Shanghai Containerized Freight Index came out at 1075.60 points, both hardly changed from last week.
In Europe service, the cargo volume stood still and the slot utilization averaged at 90%. Besides, some carriers continued reducing the freight rate, as on May 20th, the freight rate (ocean freight plus surcharges) for the voyages from Shanghai to base ports in Europe was USD 892/TEU, down 1.8% from last week. While the Europe service was perceived calm, the cargo volume in Mediterranean was relatively prosperous. Meanwhile, carriers’ previously prudent control over the capacity had gradually worked, making the slots become so insufficient that the utilization ratio reached above 95%, and laden voyages were seen as well. The apparent amelioration between supply and demand had effectively curbed and marginally upturned the freight rate’s downward trend. On May 20th, the freight rate (ocean freight plus surcharges) of the voyages exporting to the Mediterranean service quoted USD 924/TEU, which is USD 32/TEU higher than the Europe service. Industrial insiders opined that the approaching conventional peak season on the service could propel the steady rising momentum of the freight rate. Some carriers had claimed to impose a peak season surcharge, at about USD 200/TEU, on early June.
In North America service, the cargo volume of US west coast saw slightly soared, where the slot utilization kept hovering around 90%. While in US east coast, however, the unchanged over-supply kept pressuring on the freight rate, which dropped more than USD 100/FEU in some voyages. On May 20th, the freight rate (ocean freight plus surcharges) for the voyages from Shanghai to US west coast and Us east coast services were USD 1819/FEU and USD 3188/FEU, respectively slipped 1.2% and 0.9% from last week.
In Australia and Singapore service, despite the constant increase in the cargo volume after May, yet since such increase didn’t meet the market expectation, the supply-demand relation was still losing the balance, and the slot utilization had decreased to 80%. The freight rate kept falling as well. On May 20th, the freight index of the Australia and Singapore service reported 962.73 points, down 1.0% from last week. It was rumored that some carriers were poised to add capacity on the service after June, which is very likely to contribute to the capacity surplus and cool down the freight rate.
In Persian Gulf service this week, the shipment rush ahead of the Ramadan steadily pushed up the cargo volume, where the slot utilization showed above 95% and some voyages reported out of slots. On May 20th, the freight rate (ocean freight plus surcharges) of the voyages from Shanghai to base ports in Persian Gulf service was USD 1001/TEU, up 5.8% from last week.
In Japan service, the cargo volume kept hiking as end of May is coming, where the slot utilization climbed over 70% and the freight rate maintained firmly. On May 20th, the freight index of the Japan service issued by SSE came out at 824.36 points.
(CCFI Commentary in Issue 21, 2011)
This week, the China containerized transport market remained sound, with a stable comprehensive index. On May 20th, the China Containerized Freight Index issued by Shanghai Shipping Exchange was 1013.37 points; while the Shanghai Containerized Freight Index came out at 1075.60 points, both hardly changed from last week.
In Europe service, the cargo volume stood still and the slot utilization averaged at 90%. Besides, some carriers continued reducing the freight rate, as on May 20th, the freight rate (ocean freight plus surcharges) for the voyages from Shanghai to base ports in Europe was USD 892/TEU, down 1.8% from last week. While the Europe service was perceived calm, the cargo volume in Mediterranean was relatively prosperous. Meanwhile, carriers’ previously prudent control over the capacity had gradually worked, making the slots become so insufficient that the utilization ratio reached above 95%, and laden voyages were seen as well. The apparent amelioration between supply and demand had effectively curbed and marginally upturned the freight rate’s downward trend. On May 20th, the freight rate (ocean freight plus surcharges) of the voyages exporting to the Mediterranean service quoted USD 924/TEU, which is USD 32/TEU higher than the Europe service. Industrial insiders opined that the approaching conventional peak season on the service could propel the steady rising momentum of the freight rate. Some carriers had claimed to impose a peak season surcharge, at about USD 200/TEU, on early June.
In North America service, the cargo volume of US west coast saw slightly soared, where the slot utilization kept hovering around 90%. While in US east coast, however, the unchanged over-supply kept pressuring on the freight rate, which dropped more than USD 100/FEU in some voyages. On May 20th, the freight rate (ocean freight plus surcharges) for the voyages from Shanghai to US west coast and Us east coast services were USD 1819/FEU and USD 3188/FEU, respectively slipped 1.2% and 0.9% from last week.
In Australia and Singapore service, despite the constant increase in the cargo volume after May, yet since such increase didn’t meet the market expectation, the supply-demand relation was still losing the balance, and the slot utilization had decreased to 80%. The freight rate kept falling as well. On May 20th, the freight index of the Australia and Singapore service reported 962.73 points, down 1.0% from last week. It was rumored that some carriers were poised to add capacity on the service after June, which is very likely to contribute to the capacity surplus and cool down the freight rate.
In Persian Gulf service this week, the shipment rush ahead of the Ramadan steadily pushed up the cargo volume, where the slot utilization showed above 95% and some voyages reported out of slots. On May 20th, the freight rate (ocean freight plus surcharges) of the voyages from Shanghai to base ports in Persian Gulf service was USD 1001/TEU, up 5.8% from last week.
In Japan service, the cargo volume kept hiking as end of May is coming, where the slot utilization climbed over 70% and the freight rate maintained firmly. On May 20th, the freight index of the Japan service issued by SSE came out at 824.36 points.
Suscribirse a:
Entradas (Atom)